Weak-to-Strong Generalization Through a Data-Centric Lens
Published:
Authors: Changho Shin
In recent years, the phenomenon of weak-to-strong generalization has captured significant attention. This setting involves training a strong model using labels or supervisory signals generated by a weak model—yet, remarkably, the strong model eventually outperforms the weak model. Our work takes a data-centric perspective, exploring how the intrinsic properties of data drive this improvement.
What is Weak-to-Strong Generalization?
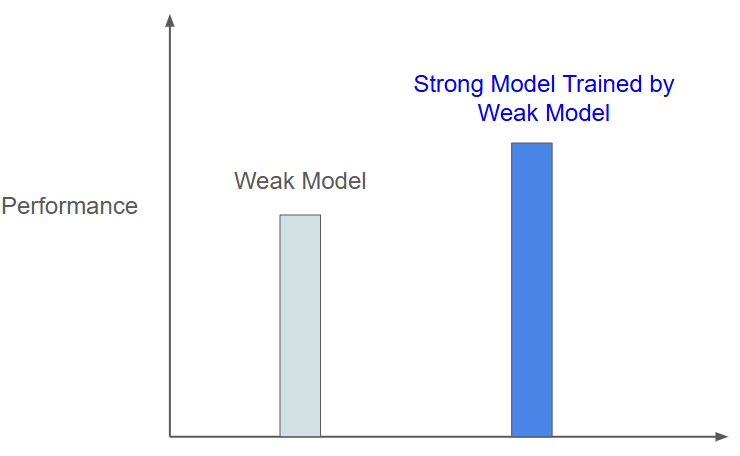
Weak-to-strong generalization describes a scenario in which a strong model, trained on pseudolabels or outputs provided by a weak model, achieves superior performance compared to the weak model itself. In such settings, the weak model is capable of making predictions on a broad range of data, while the strong model leverages these predictions as a foundation to learn additional, more complex aspects of the data. This phenomenon is critical in contexts such as data-efficient learning and has implications for building more advanced, robust systems.
Data-Centric View: Overlap Density
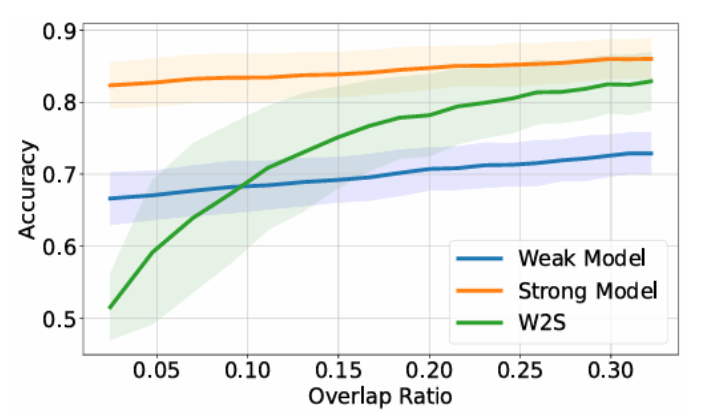
A key insight from our work is that the potential for weak-to-strong generalization is driven by the overlap density in the data. Overlap density quantifies the proportion of data points that contain two complementary types of informative patterns: one that the weak model can readily capture and another that requires the capacity of a strong model. More formally, consider a dataset where each input ( x ) can be decomposed as
[ x = [x_{\text{easy}}, x_{\text{hard}}], ]
with ( x_{\text{easy}} ) representing features that are easily learned by the weak model and ( x_{\text{hard}} ) representing the more challenging features. Based on this decomposition, data points can be partitioned into three regions:
- Easy-only points: Points containing only ( x_{\text{easy}} ).
- Hard-only points: Points containing only ( x_{\text{hard}} ).
- Overlap points: Points containing both ( x_{\text{easy}} ) and ( x_{\text{hard}} ).
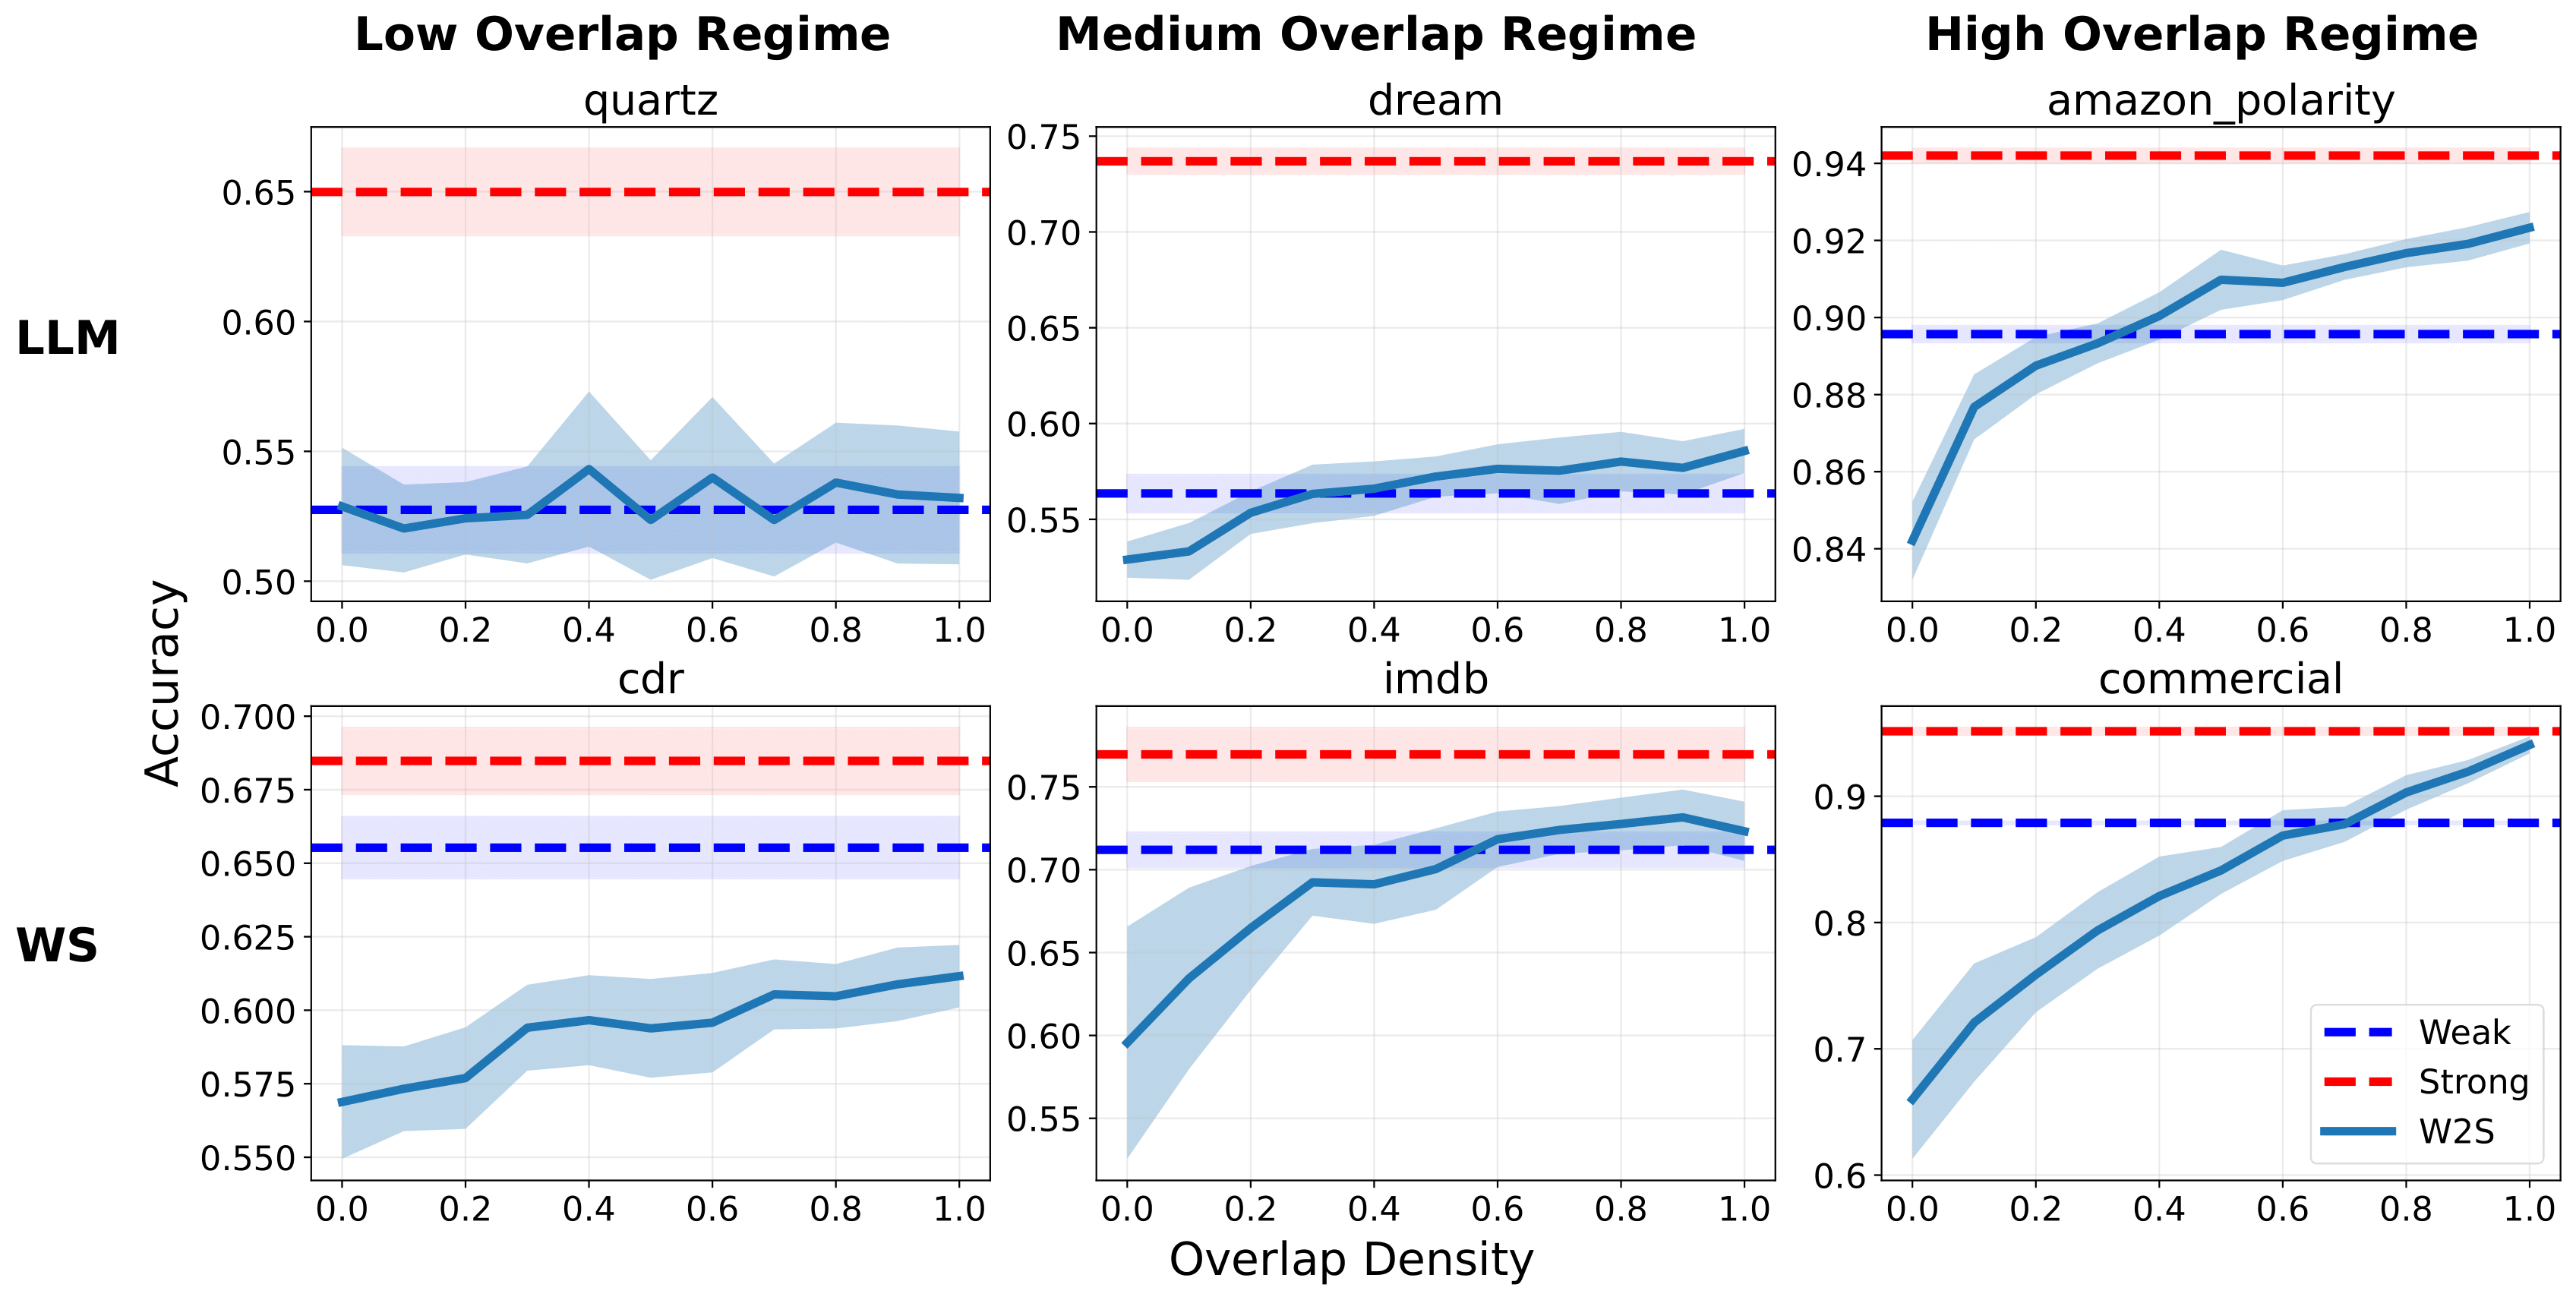
Overlap density is defined as the proportion of overlap points in the dataset. These overlap points are critical because they serve as a bridge: the weak model can accurately label them using the easy features, while the strong model can leverage these labels to learn the challenging features. This mechanism lays the foundation for a strong model to effectively leverage supervision signals from a weak model.
Overlap Detection in Practice
However, overlap density is not directly observable in real-world data since easy and hard features are not easily defined. To overcome this challenge, we developed an overlap detection algorithm that operates in two main steps:
Confidence-Based Separation:
The algorithm first uses the weak model’s confidence scores to separate data points. Typically, points where the weak model is less confident are likely to lack the patterns it can easily capture. By thresholding these confidence scores (using methods like change-point detection), we identify a subset of points that are likely to be dominated by the challenging patterns.Overlap Scoring: After the first step, we identify two groups: hard-only points (low confidence) and non-hard-only points (high confidence). Our next goal is to pinpoint the overlap points within the non-hard-only group. We achieve this by defining overlap scores based on the distance to the hard-only points. The intuition is that overlap points are closer to hard-only points because they contain some of the challenging features that easy-only points lack. Thus, among the non-hard-only points, those with small distances to the hard-only points are classified as overlap points.
This procedure yields an estimate of the overlap density in a dataset, which is crucial for understanding and enhancing weak-to-strong generalization.
Data Source Selection for Maximizing Overlap Density
Beyond estimating overlap density within a single dataset, our approach extends to selecting the best data sources from multiple candidates. The idea is to prioritize sources that exhibit a high overlap density, as these are more likely to provide supervisory signals that enable the strong model to learn the challenging aspects of the data.
Our UCB-based (Upper Confidence Bound) data selection algorithm works as follows:
- Initialization:
- Sample a small batch from each available data source.
- Apply the overlap detection algorithm to estimate the overlap density for each source.
- UCB Computation:
- For each source, calculate an upper confidence bound on its overlap density, balancing exploration (sampling less-visited sources) with exploitation (focusing on sources with high estimated overlap).
- Iterative Selection:
- Over several rounds, select the data source with the highest UCB score.
- Sample additional data from that source, update the overlap density estimates, and repeat the process.
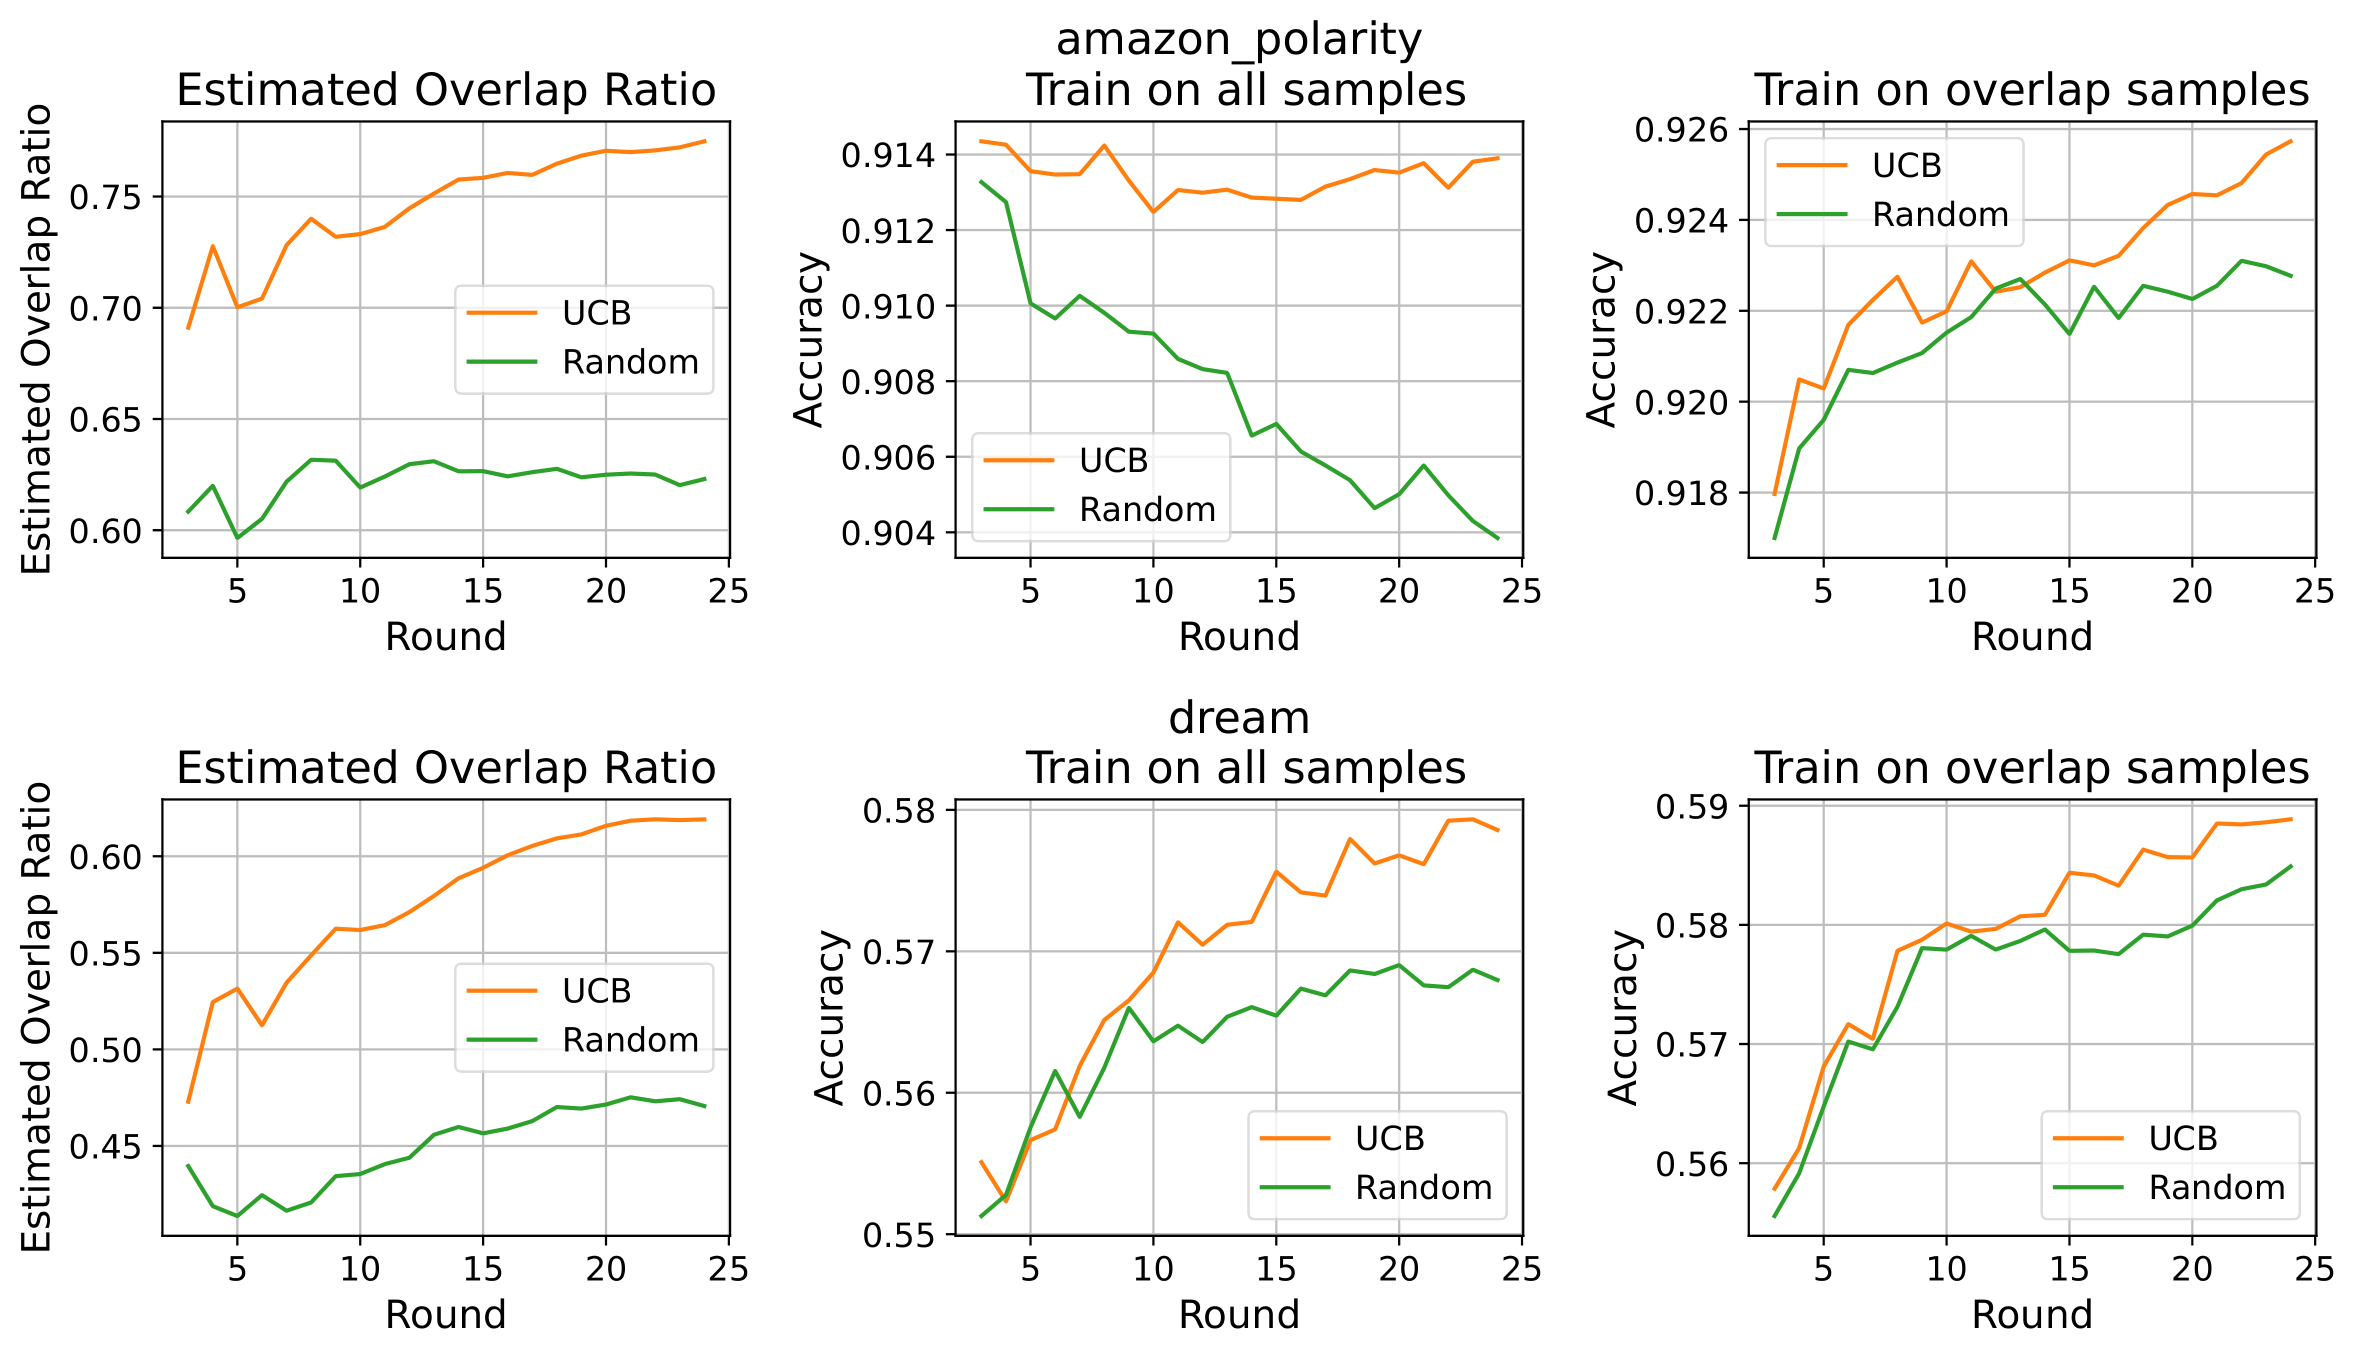
Our experiments on datasets such as Amazon Polarity and DREAM demonstrate that this UCB-based strategy consistently identifies data sources with higher overlap density. When training the strong model with data selected through our algorithm, we observe improved generalization performance compared to using randomly sampled data.
Concluding Thoughts: A Path to Superintelligence
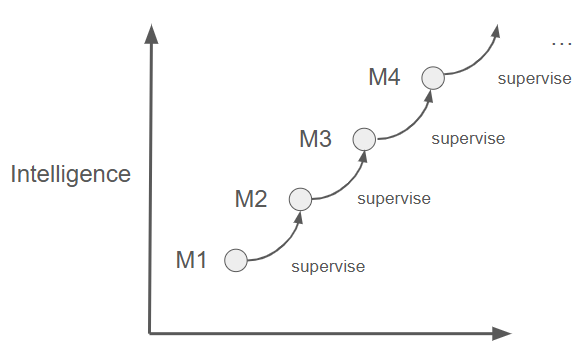
Our exploration of weak-to-strong generalization through the lens of overlap density paves the way for continuous, iterative enhancements in model performance. By identifying and leveraging data points that exhibit both easily captured and more challenging patterns, we can significantly boost the effectiveness of weak supervision. This data-focused strategy—prioritizing optimal data sources above all else—may prove crucial for developing truly advanced systems.
Weak-to-strong generalization may hold the key to achieving superintelligence. As AI evolves, the pool of human experts capable of providing meaningful supervision is shrinking. For instance, as mathematicians are increasingly tasked with annotating complex math problems, the scarcity of such expertise becomes a significant bottleneck. In the long run, efficient supervisory signals will be essential, making a deep understanding of weak-to-strong generalization vital.
Moreover, this process mirrors human academia—learning from imperfect past knowledge, generalizing it, and continuously pushing the boundaries forward. We believe our study on weak-to-strong generalization offers a principled pathway for scientific discovery.
To delve further into our theoretical analysis and experimental findings, please refer to our paper at https://arxiv.org/abs/2412.03881 and explore our implementation on GitHub at https://github.com/SprocketLab/datacentric_w2s.